beacon
Usage telemetry for a fleet of internal AI tools — because a browser pixel can't see an LLM call, a cron job, or a Slack bot.
team one internal service, deployed in production on the agency's internal aws/eks platform. app names, keys, and urls withheld.
By August 2026 the agency had roughly 28 internal AI tools registered on its container platform and an AI council that needed an adoption signal: which tools are used, by whom, how often the model keys get called, and what that costs per app — something a shared provider key can't tell you. Nothing measured it. Four apps captured their own token counts locally, six had private audit logs, most had nothing.
The default answer — Google Analytics — would have covered the least interesting slice. Page views are browser-side; LLM calls, token counts, background jobs, and Slack-bot interactions are all server-side and invisible to a pixel. And the tools touch client data, so an external analytics processor meant a new approval cycle with the client's parent organization.
The fleet is unusually uniform: three backend shapes, one deploy pipeline, one domain suffix, and a platform mechanism for injecting a shared secret into any app. That makes “weekend-scale” telemetry honest rather than ambitious — one ingest endpoint, one events table, rollups, a read API. Self-hosting a product-analytics suite would have been more ops than the custom thing and still wouldn't meter model calls. So: self-rolled, in-account, and designed around the finding from an 18-repo scan — almost every app already had a single LLM wrapper file. Instrument there, once, and don't wrap SDKs.
Cost is computed at ingest, never in clients. Clients send raw provider, model, and token counts; the server holds the price table. A price change is one deploy of the telemetry service, not pull requests to twenty repos. Unknown models cost zero and are flagged unpriced, so the dashboard surfaces gaps instead of under-reporting — and the hourly rollup re-prices them retroactively once the table learns the model.
Fire-and-forget; never bounce a caller. The ingest endpoint answers 202 to any authenticated request; malformed events are dropped and counted; even an internal ingest failure returns “deferred” rather than an error. Clients are silent no-ops when the URL and key are absent, so dev machines and un-bundled apps are unaffected. Browser page views ride sendBeacon — which survives page unload but can't set headers — so a separate restricted public key, limited to page views and actions, travels as a query parameter.
Vendored, not published. Three single-file clients — Node with adapters for Express, Fastify, raw http, Next middleware, and Slack Bolt; Python ASGI; browser — copied into each repo. No package registry to maintain, no new dependencies. The per-app integration target was written as a runbook an AI coding agent could execute: vendor one file, about five lines, one recordLLM call at the wrapper, one PR, under thirty minutes.
Accept anonymous events. Identity was the fleet's weak point — strong in about eight apps, absent in about eight. Blocking weak-identity apps would have meant no signal at all; the service takes events with no user id and the dashboard says so.
One FastAPI workload and an hourly rollup cron, managed Postgres underneath. App → vendored client (in-memory queue, 5-second / 50-event flush, flush on exit) → batch ingest → validate, price model calls, touch the app registry → raw events with 90-day retention → hourly rollup into a daily table kept forever (re-aggregating the last three days to absorb late arrivals, healing unpriced rows, pruning old raw) → read API behind a third key → the program hub's council dashboard and a built-in explorer. Nine endpoints, three tables, three scoped keys, seven event types, ~830 lines of Python. The app registry is a side effect of ingest — first seen, last seen — which is exactly the list a later service diffs to auto-create a case-study stub for every tool in the fleet.
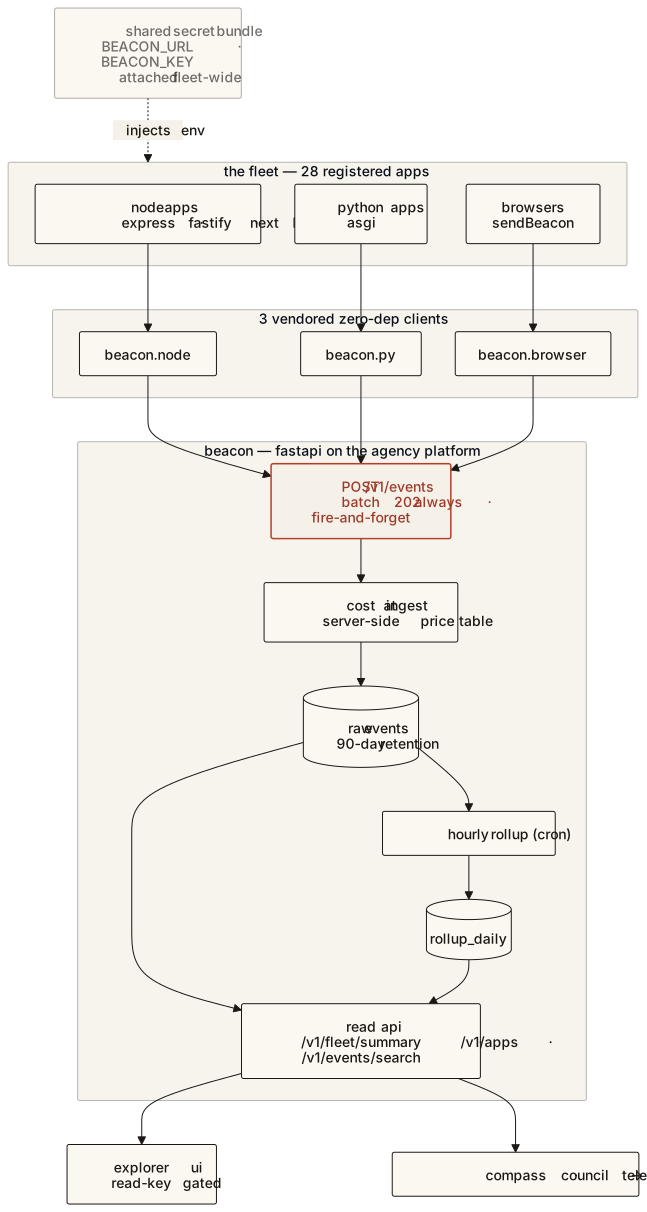
Distribution is the quiet trick: the platform's shared secret bundle injects the telemetry URL and write key into any app on its next deploy, and the instrumentation PR's merge is the deploy — attach-then-ship is one step. The service dogfoods itself from day one (its own read-API usage is recorded through the same middleware), and the hub that hosts the dashboard was the first app instrumented.
Four lessons in eleven days, each now a line in the runbook. Day one: page views were inflated about 10× by Next.js link prefetches and load-balancer health probes — filtered by header and user agent. Day four: every browser page view from every app had been silently dropped, because sendBeacon always sends credentials and the framework's CORS middleware omits the allow-credentials header unless told — found on one app, fixed centrally. Day ten: the managed database's weekly password rotation crash-looped the ingest pod (64 restarts) because a platform-injected connection string took precedence over the live-credential resolver — the same dead-code bug a sibling app had just fixed (see rotation-proof).
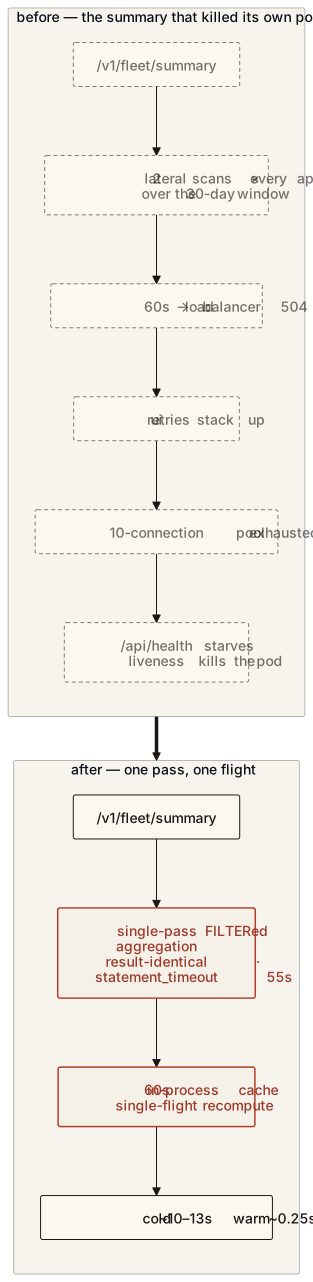
And the next morning, the dashboard went blank with all ~1.7 million events intact. The fleet-summary query ran two lateral scans per registered app over the 30-day window — 56 scans of the same 1.5-million-row table — and at that volume it outran the load balancer's 60-second timeout. The 504 made the UI retry, the retries exhausted the ten-connection pool, the health check starved, and liveness killed the pod. The fix: one single-pass aggregation with SQL FILTER clauses (verified result-identical), a statement timeout just under the load balancer's, and a 60-second in-process cache with single-flight recompute. Cold ~10–13 seconds, cached ~0.25.
Version 0.1 — ingest, pricing, rollups, read API, three clients — landed in a single commit and was in production the same day. The hub was instrumented that day; thirteen more repos were instrumented, reviewed, and merged in a 44-minute window three days later, by coding agents executing the runbook in parallel; four apps migrated the following week shipped with telemetry built in. As of late August: 18 apps reporting in the trailing week, model spend visible per provider, model, and app, and a council dashboard that flags quiet tools and unpriced calls instead of guessing.
Honest caveats: raw event volume is dominated by load-balancer probe traffic on apps whose health path is the root — so “events ingested” is infrastructure, not usage, and the usage read comes from page views, model calls, and jobs. Identity is still thin across the fleet. And the case-study service that diffs the registry has created a draft for every tool (eighteen on its first run, in under a second) — the inventory and pipeline exist; the authoring is the next phase.
Instrument the seam, not the SDK. Nearly every app already routed its model calls through one wrapper file — so fleet-wide telemetry was one function call per app, and cost lives server-side where a price change is one deploy instead of twenty pull requests.
the insight