lens
When API access to the analytics platform was declined, manual exports became the permanent feed. Lens makes them cumulative: upload any CSV, get it assessed into one fact store, and ask questions that come back as answers or as the export recipe for the missing data.
team one internal tool, deployed on the agency's internal aws/eks platform. analytics figures, report names, and vendor specifics withheld; the test corpus of real exports stays out of the repo. usage is not measured.
API access to the site-analytics platform had been declined, which meant manual CSV exports were the only way data was ever going to leave it. Every export was a one-off. Each project that needed the data wrote its own parser, keyed to the panel titles of one report, landing into its own named tables. The work was repeated, and nothing accumulated.
The exports themselves are hostile: dozens of panels per file, one to three header rows, totals rows posing as data, chart panels that export no numbers, comparison columns labelled “last month” that can't be resolved without the file's date range, and caveats buried in comment lines.
The ask could have been one more parser for one more report. The reframe was that the constraint (exports only, forever) is permanent, so the system should make exports cumulative: any CSV, from any source, lands in one canonical store and joins everything already there.
Two rules held the design together. First, no templates: formats are recognizers plugged into a generic loop, not the spine of the system, so a plain date,channel,visits file or a model-by-month pivot lands as cleanly as the hardest analytics dump. Second, the model is an assessor and creator, never a calculator. It proposes chart specs, hypotheses, and prose; a deterministic query layer validates and executes every one. It never computes a number and never writes SQL.
Ingest → assess → persist. Every upload goes through the same loop: sniff (encoding, delimiter, how many blocks the file really holds), grid (header rows, label column, totals rows), roles (which columns are time, dimension, metric, segment, or a packed series of weekly values in a single cell), canon (raw labels mapped onto shared dimensions through aliases), persist. Confirmed mappings are saved as learned recognizers, so the next file with the same shape lands with no clicks.
Guarantees instead of guesses. Every stored value is a cell from a file or a row from the warehouse, with the raw label kept beside the canonical one. Anything that can't be resolved, like a relative-period comparison, lands as needs-review or skipped with a reason, never silently dropped. Totals rows stay attached to their dimension, and periods that extend past the export date are flagged partial.
The missing-data answer. Dashboards and the AI share one typed query spec. Validation returns either a result or a missing data response with an export recipe: what to pull, which dimension and metrics, at what grain, for which fixed date range. Ratio rules live in the same place: unique visitors are never summed across periods, and rates are recomputed from their parts when both exist.
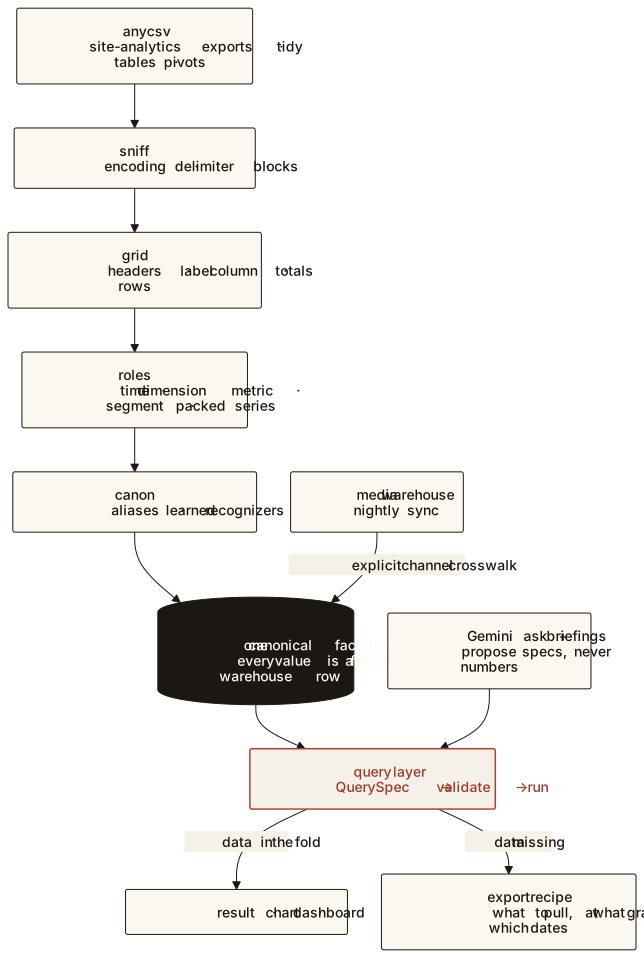
Site exports and the media warehouse land in the same fact store. The warehouse arrives through a nightly sync over a cloud data API, and the two sides meet on an explicit, editable channel crosswalk (paid search to search, paid social to social, and so on), never an inferred join. Any chart that spans both sources is labelled as an approximate join.
On top of the store: generated dashboards (overview tiles, trends with a prior-year overlay, breakdowns, funnels, media views), with a table view behind every chart. Ask runs a function-calling loop with exactly two tools, query data and propose chart, and any answer can be pinned to a dashboard.
Briefings behave like an analyst reviewing the whole store on a schedule, with a daily scan and a weekly report. Deterministic detectors find the candidates: level shifts (a robust z-score plus a cumulative-sum check), year-over-year outliers, share shifts inside a dimension, funnel step changes, series that used to move together and stopped, and data-quality problems like gaps, suspicious zeros, and stale panels. The model writes hypotheses with a test plan, the query layer runs every test, and hypotheses that fail are reported briefly too. Each finding takes feedback: useful, known, or wrong.
Long jobs run in the background because the platform caps requests at the ingress, and database connections resolve credentials per connect, the lesson from rotation-proof.
The plan's phase table added up to about three weeks of work. Lens was built and deployed on August 28, 2026: 24 commits, roughly 4,700 lines of Python and TypeScript, from scaffold to briefings, with synthetic fixtures (multi-row headers, pivots, semicolon-delimited, packed series, totals rows) covering the ingest cases.
What it doesn't claim: usage. It isn't measured yet, and briefings quality has to earn trust before any digest goes out to a channel. The part that already holds is structural: a team without API access now has a place where every export adds to what came before, and a tool that tells you exactly what to export next instead of inventing the missing number.
When the API is the thing you can't have, make the manual export cumulative. Code owns every number, the model proposes specs, and when the data isn't there the right answer is the recipe for getting it, not a guess.
the insight