pulse
Ad tags fail silently. Pulse watches the measurement layer itself — across lexus.com and the dealer network — and keeps the history the vendors won't.
team one internal tool, deployed in production on the agency's internal aws/eks platform. vendors generic, tag names generic, identifiers withheld. no detection-speed or false-positive rates are claimed because none have been measured.
Ad ops monitored the client's first-party conversion tags — the ad server's activities and the video vendor's equivalents — by pulling a 90-day report for ~75 tags and pivoting it by hand to look for the canyon where a line hits zero. Breaks were found by someone else, months later: “this hasn't fired in three months — why didn't you check earlier?” The validating case: four dealer payment-estimator tags dropped on February 16, were noticed March 25, and had silently recovered around April 8 — the first Pulse pull in May showed both events, and nobody had seen either.
A June leadership escalation about site-analytics tags dropping on lexus.com framed the broader problem precisely: remediation is fast (one-to-two-day hotfixes); detection is the gap.
Two buckets, don't conflate them: site-analytics tags (a third-party analytics partner's spec, ~19K tagged elements, no source of truth for expected values) and media tags and pixels (ad server, video vendor, social), owned by ad ops. Pulse is the media bucket — with the anomaly engine built source-agnostic so the analytics bucket can arrive later as another source.
Keep your own history. The ad server serves 60 days and no more; upsert daily into Postgres and the database remembers what the vendor won't — which is what makes 30-day day-of-week baselines, 90-day drift horizons, and quarterly benchmarks possible at all. Detect deterministically, narrate with a model. And the subtle one: neither source ever writes a zero row, so a dead tag hides itself. Windows anchor to the source's own latest date and missing days are zero-filled. Absence is the signal, and you have to manufacture it.
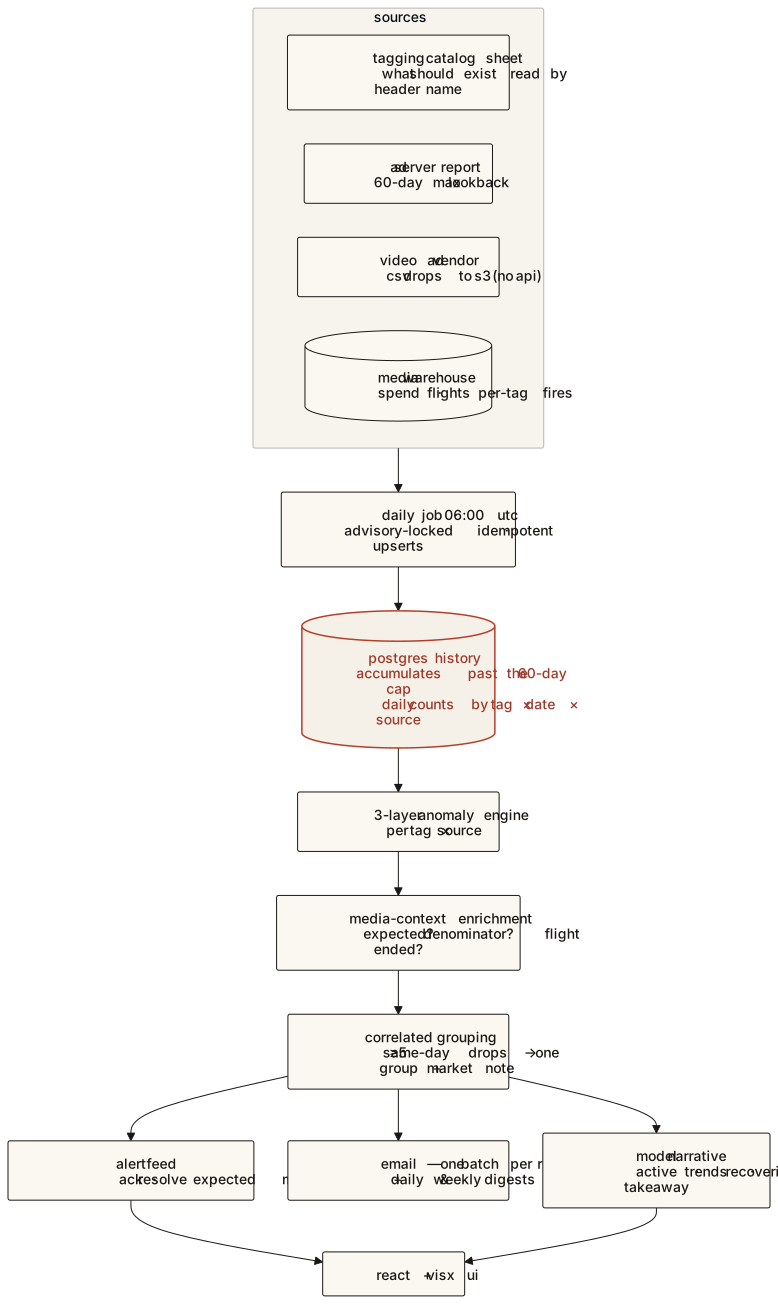
Four sources, each with its own quirk. The tagging catalog sheet (what should exist — 2,246 rows, “every tag ever created”) is read by header name, not column position, because the sheet gets reordered and silently mis-maps the join key. The ad server's conversion report runs as an async insert-run-poll-download job with its hard 60-day cap. The video vendor has no API at all — confirmed with their client-success team — so they drop gzipped CSVs of raw hits into an S3 prefix we own, in overlapping seven-day files so a missed day self-heals. And the agency's media warehouse (165.8 million rows, 153 columns) sits in a private network, reachable only through a data API with temporary credentials — aggregated on read into two tiers with 13-month retention.
Per-source baselines, mandatory. The two systems report the same action at very different levels (often ~2×), so detection runs on each stream separately and the ratio between them is its own signal: cross-source divergence learns the vendor/ad-server ratio with median and MAD and alerts on a ratio shift, not an absolute gap.
One root-cause alert, not fifty. Drops detected on the same day, five or more, collapse into one correlated group; if most of the group shares a market and the media stopped or the flight ended, the group gets a note: “likely one media event.” One email per run, not per alert, so a bad day can't flood inboxes; per-recipient severity floors; daily and weekly digests.
“Was this change expected?” Media context runs between detection and email: a three-day alert window against a 28-day baseline of spend and flights. Flight ended or media stopped → expected. Drop proportional to a media decline → labeled as such. Media kept delivering while fires died → media contradicted, a real break. Plus the de-dupe rule learned from the daily-nag bug: marking a drop “expected” has to stick, or the next run re-raises it forever.
An eight-step daily pipeline at 06:00 UTC under a Postgres advisory lock (so a manual run and the scheduled run — or two replicas — can't double-fire): catalog sync → ad-server report → vendor S3 ingest → dealer sync and media-lake pull → warehouse aggregates → detection, media-context enrichment, and the immediate alert batch → model narrative → daily digest. Every writer is an upsert; a startup sweep clears pulls stuck “running.”
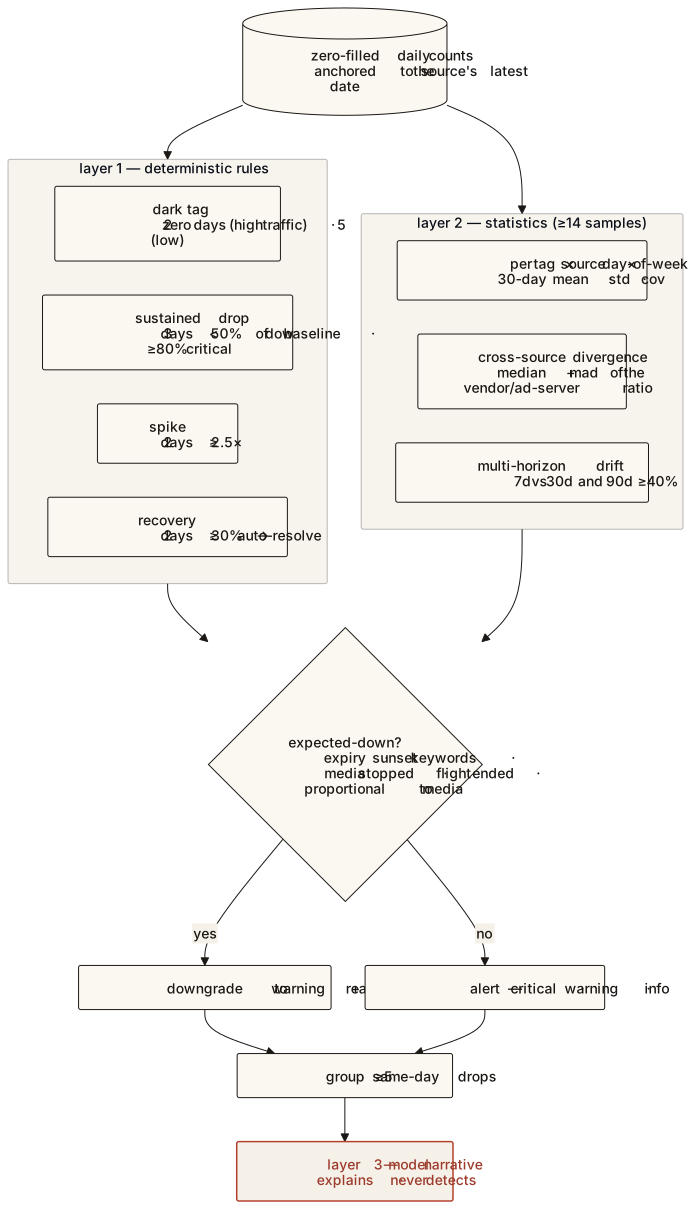
The engine, as actually implemented. Layer 1, deterministic rules: dark after two consecutive zero days for high-traffic tags, five for low; sustained drop = three consecutive days each under 50% of the day-of-week baseline, critical at 80%; spike = two days at 2.5×; recovery = two days back above 30% → auto-resolve; at least fourteen baseline samples before a drop can fire, because a brand-new stream fires spuriously; expiration dates and sunset keywords downgrade expected retirements. Layer 2, statistics: per tag × source × day-of-week over trailing 30 days; the MAD-based divergence detector; and multi-horizon drift — a 7-day mean deviating 40% from both the 30- and 90-day means in the same direction, at info severity, a benchmark design adopted from the programmatic team's sister detector rather than rebuilt. Layer 3, the model: reads structured detector output — counts by severity, the top alerts with their correlation flags, recoveries, top tags by volume — and writes at most eight bullets. It narrates the conclusion, not the mechanics. Even the “talk to the data” natural-language query feature enforces its SQL guardrails in Python, not in the prompt.
In production since May on the internal platform (a two-week parallel consumer-hosting POC was retired once the platform reached parity), 44 commits through late August, 149 backend tests with the detection core the best-tested area. Two proof points that mattered internally: in June, Pulse independently flagged a high-value-action tag drop that had already upset media clients, and the same-evening write-up from its raw pulls pinned the exact window, ruled out the suspected release, and earned the analytics, account, and delivery leads' thanks; the media organization's formal ownership chart now lists Pulse as a detection layer. In August a second anomaly — model-specific offer events shifting to a generic event — was traced from Pulse's data to a tag-manager change, not a code deploy.
The honest ledger from the project's own August self-audit: adaptive per-tag variance bands are computed and stored but not yet wired into the detectors (the rules compare to the rolling average with global or overridden percentages — only divergence is truly adaptive); and a per-step exception guard means the telemetry can show a green run while every step failed, which is the top of the hardening backlog. No time-to-detect or false-positive rate has been measured, so none is claimed. Slack and Teams alerting, and the site-analytics bucket, are the roadmap.
Analytics fail silently — the measurement layer needs its own measurement. A broken tag looks exactly like a quiet day until you check, and the sources never write a zero: absence is the signal you have to manufacture.
the insight