sprint tracker
The velocity dashboard, graduated: AI sprint reports, feature buckets, and an OKR scorecard that replaced a product owner's quarterly spreadsheet — with a fail-closed bridge to a second app.
team one internal tool, deployed in production on the agency's internal aws/eks platform. client baseline figures withheld; relative results only.
The successor to the Jira velocity intelligence dashboard: same persistent-structure architecture, rebuilt as a product with separate frontend and backend workloads, permanent sprint history, AI-generated sprint reports published to the wiki on sprint close, feature-bucket analytics with a human review queue for model recommendations, a manual-override flag so human corrections survive every sync, and a client-priorities alignment view parsed from the priorities page.
Then a new job showed up. A product owner was hand-tracking six quarterly Key Results — JQL in one tab, a release-analytics page in another, arithmetic in a doc, about two hours a quarter — and the numbers lived only in that doc. Four of the six were already implicit in the dashboard's ticket store. The other two (hotfix rate, release frequency) could only come from a separate release-notes application.
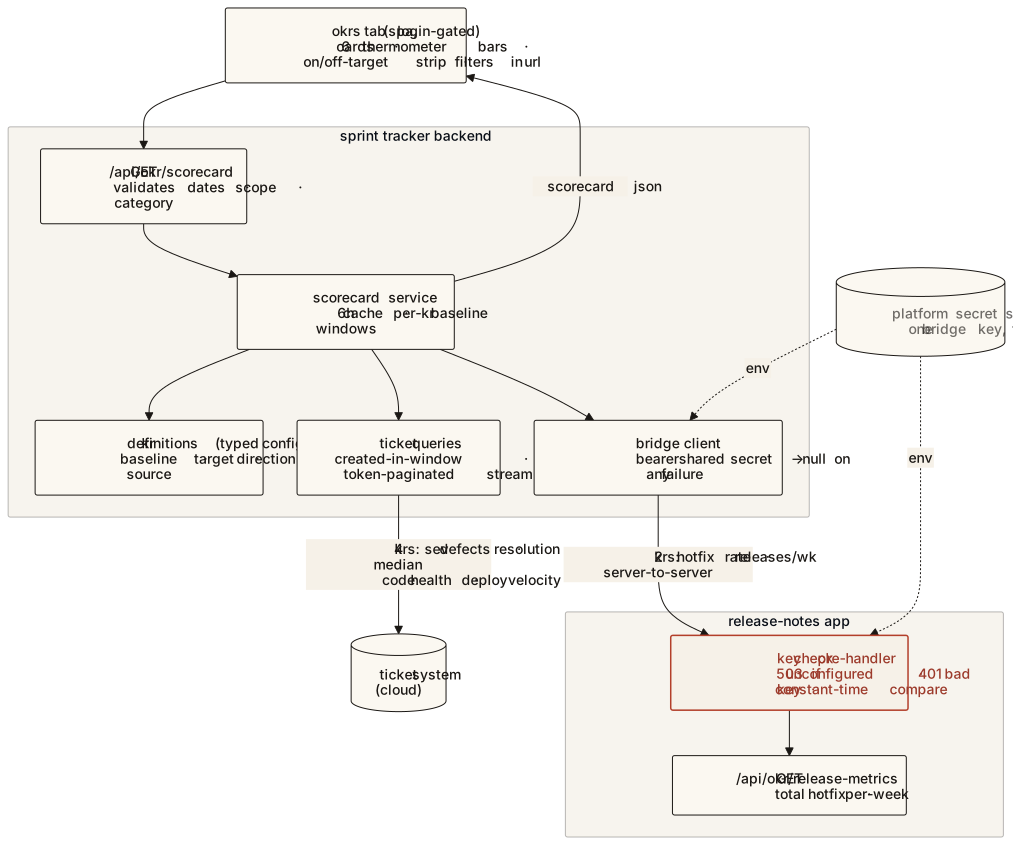
Don't build an OKR tool. The dashboard is the home — it already holds a synced ticket store and the team and sprint model, so four KRs are queries, not a system. The two release KRs come over a narrow, secured, server-to-server bridge to the release-notes app: no second UI, no copy of the data. KRs themselves are typed config — unit, direction, source, composite, baseline, target — so the scorecard ships without a migration and can be seeded into a table later if anyone needs to edit targets in a UI.
Reproduce the human's numbers first. The product owner's hand-computed results became the test fixtures. Two KRs reproduced to the decimal from her exact JQL before anything shipped. Two baselines didn't reconcile — the gap was definitional (scope, classification) — and rather than fudge, the cards carried an amber “methodology pending” note until she confirmed the measurement basis a month later, at which point the notes came out.
Measure what the baseline measured. The first cut of deployment velocity filtered on resolution date and returned a ~370-day median — long-dormant tickets closed late dominated it. Created-in-window gave ~13 days, in the ballpark of the stated baseline. Every KR uses created-in-window semantics now, and with no explicit range each KR defaults to the window its baseline was measured over; the header says so instead of implying one shared range.
Fail closed; degrade gracefully. The bridge endpoint refuses to serve at all if its key isn't configured (503), refuses bad callers (401) with a constant-time compare, validates dates, and never echoes the token; the key lives in the platform's secret store, injected into both apps, and never reaches a browser. On the consuming side the bridge client returns null on any failure and the two release cards say “release data unavailable” while the other four render.
Binary honesty over nuance. The first visualization — four status tiers, a floating dot, a good-zone that flipped by direction — was judged unclear. The contract became: green if the target is met (direction-aware), red if not; a fixed baseline tick and target line at the same x on every card so they line up; the big number in the same color; a summary strip counting on and off target. And one more real bug: “49 releases” turned out to be three projects counted together — the default scope narrowed to the project the baselines were measured against, with project, release-type, and date filters in the URL so views are shareable.
Express backend and React SPA as two workloads; managed Postgres via Prisma with eighteen models; per-team cron sync from the ticket system's Agile API into the ticket store; an OKR service that runs JQL counts and token-paginated streams (the modern search endpoint rejects offsets, so the stream follows the cursor with a hard page cap) plus one bridge call per scorecard, cached for six hours because the deployment-velocity KR streams ~4,000 tickets and the numbers are reviewed monthly, not minute by minute. The release-notes app exposes one Fastify route behind a key-check pre-handler that reads the same query already powering its analytics page.
The earlier generations are still in the same codebase: the sprint-close report pipeline (sync → velocity snapshots → data context → model in JSON mode → stored report → one-click wiki publish) and the feature-bucket engine with batched, cached model recommendations that a human approves in a review modal. Plus the fleet's rotation-aware database pool, which this app adopted in June after the weekly password rotation silently killed its backend behind a static health check.
The OKRs tab went live at the start of July, login-gated, replacing the quarterly spreadsheet; a data-definition question raised the same day (content versus code releases) was resolved with a filter that evening. Bridge values matched the release-notes app's own analytics exactly at launch. The delivery lead's verdict on the feature-buckets view — the unprompted kind — was that it amounted to a new BI dashboard the team didn't have to buy. Referrals to new product owners have been organic since.
Not measured: hours saved beyond the product owner's own estimate, or usage counts — the app wasn't instrumented for that until the fleet telemetry arrived. Stated as such.
Internal tools graduate. The spreadsheet became a dashboard, the dashboard became a product — and the product earns new jobs (an OKR scorecard) because it already owns the data. Reproduce the human's numbers before you replace them.
the insight